

Energy Management
LITEON has adopted the ISO 50001 standard for energy management across key operational sites, covering the use of electricity, diesel, and various other energy sources. We carry out energy audits on equipment that consumes energy to identify Significant Energy Uses (SEU) and, when necessary, establish Energy Performance Indicators (EPI). Our regular monitoring of energy consumption and annual energy-saving initiatives enable us to assess and improve energy-saving performance. Enhancements in energy efficiency may involve upgrading existing equipment, renewing assets, or investing in new technologies. Additionally, we provide energy-saving education and training for employees to promote consistent reductions in energy usage. The energy management team sets specific energy-saving goals, routinely reviews their progress, diligently documents results, and conducts internal audits along with management reviews. LITEON is committed to achieving 100% renewable energy usage by 2040. Consequently, key operational sites consistently monitor their renewable energy consumption and collaborate with renewable energy suppliers or harness self-generated solar energy to meet renewable energy targets and satisfy client objectives.
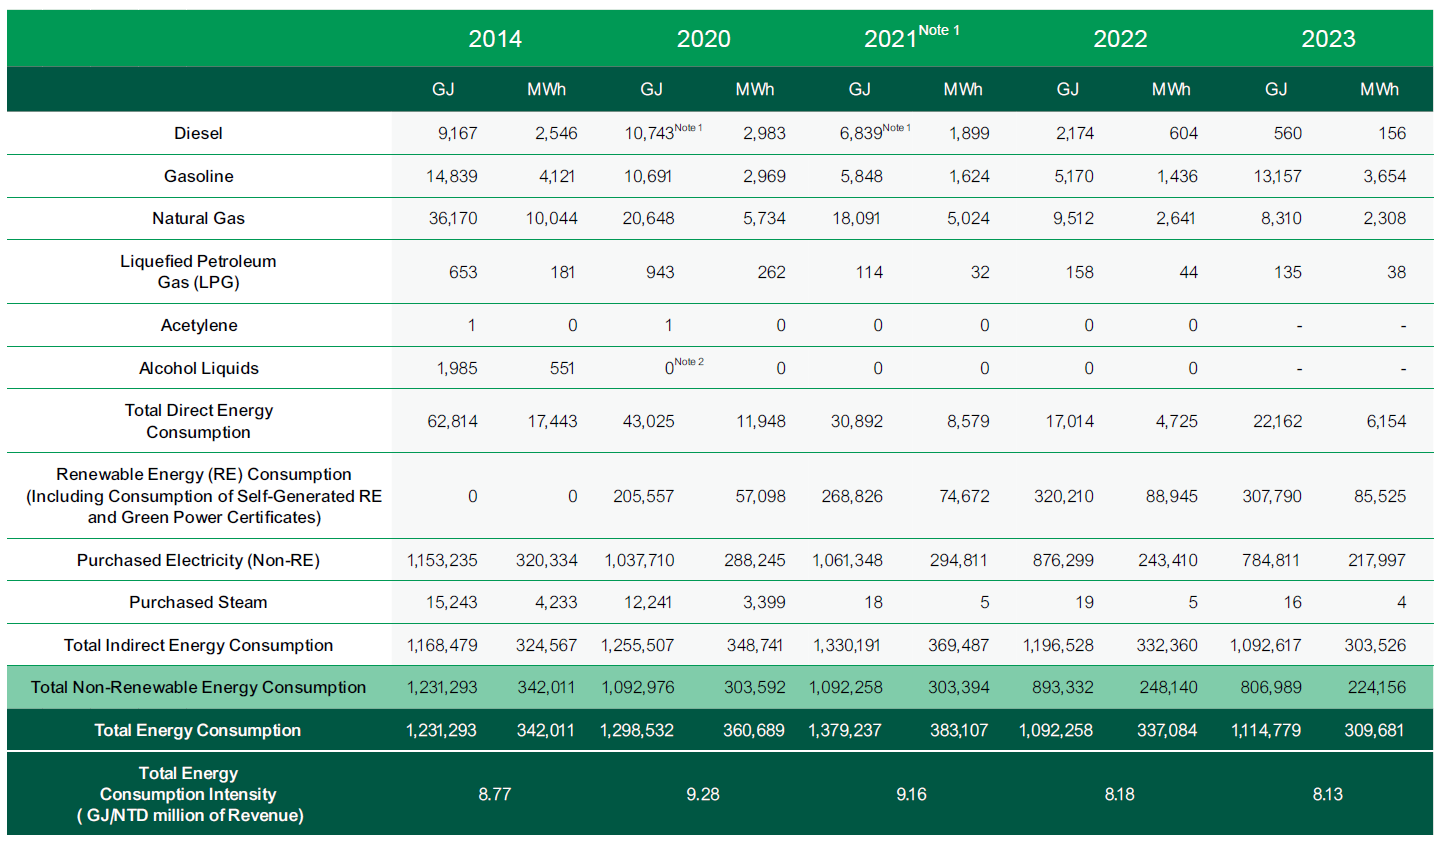
Direct and Indirect Energy Consumption
The majority of energy consumption at LITEON's operational and production facilities is derived from purchased electricity, with steam as the next largest source; indirect energy consumption accounts for 97% or more of total energy usage. Direct energy consumption at LITEON primarily stems from the utilization of fossil fuels such as diesel, gasoline, natural gas, liquefied petroleum gas (LPG), acetylene, and alcohol-based liquids, which are mainly employed in emergency generators, forklifts, buses, restaurants, and dormitory boilers. In 2023, LITEON's total energy consumption was recorded at 1,114,779 GJ, representing a decrease of 98,763 GJ (an 8.1% reduction) compared to 2022. The energy consumption intensity was measured at 8.13 GJ per million NTD of revenue, reflecting an 8.14% reduction from the previous year's energy consumption intensity. This decrease is largely attributed to the effective implementation of energy conservation measures.
| 2017 | 2018 | 2019 | 2020 | 2021 | 2022 | 2023 | |
| Renewable Energy Consumption (MWh) |
15,385 | 20,447 | 45,062 | 57,098 | 74,672 | 88,945 | 85,495 |
| RE Percentage | 3.61% | 5.05% | 13.08% | 16.53% | 19.79% | 26.8% | 28.3% |
